Project Details:
Type: Exploratory-evaluative research to answer a strategic research question for a delivery team at Virgin Pulse
My Role: UX Researcher
Methods Employed: Storyboarding | Speed Dating (a form of Concept Evaluation) | Affinity Diagramming | Longshot Display
Tools used: Sharpie & Paper | Microsoft Word | Zoom | Miro | Figma
Project Scope:
As the lead UX Research Individual Contributor for delivery teams at Virgin Pulse focused on Health Analytics & Personalization, I am often asked to help teams understand our users' needs as they relate to specific features. One team, focused on machine-learning (ML) driven recommendations, asked for support around a very tactical research question:
Is there value in building a "remind me later" option when we give a call-to-action about a sensitive health topic?
Because I serviced so many teams at Virgin Pulse, I tended to serve as a research consultant to UX designers on smaller-scope questions - but this one felt particularly important. To ensure the project was more strategic than purely tactical, I expanded the scope of the study, exploring our users' needs and comforts around ML transparency, data sources, and different tiers of sensitivity of health topics.
Research Planning
I made several decisions to help keep the research process moving fairly quickly:
• Recruiting from our opt-in user panel instead of specialized populations
• Running 8-10 sessions and ensuring they stayed under an hour long
• Ensuring synthesis was a collaborative exercise among key stakeholders
I shared these decisions with the delivery team via word document Research Plan, the "schedule" part of which is pictured right, to ensure alignment before project launch.
I was responsible for all "evaluations" and deliverables in each phase of research.
This matrix helped me swiftly create the required storyboards. One additional set was later added.
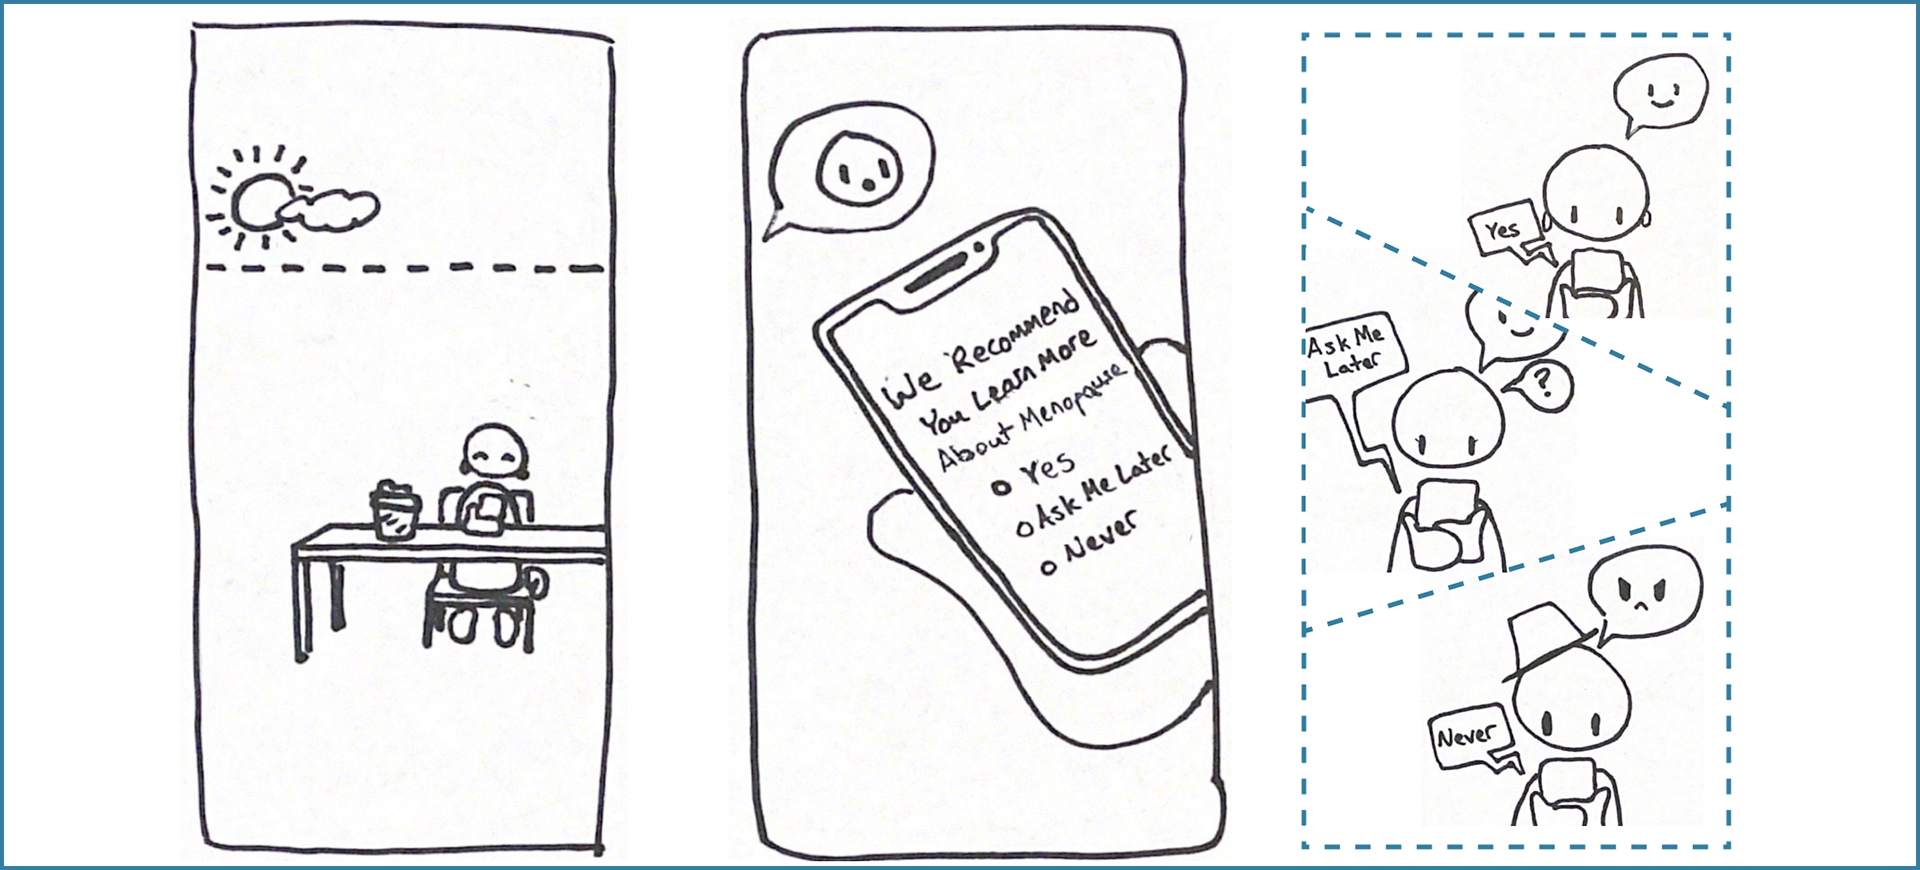
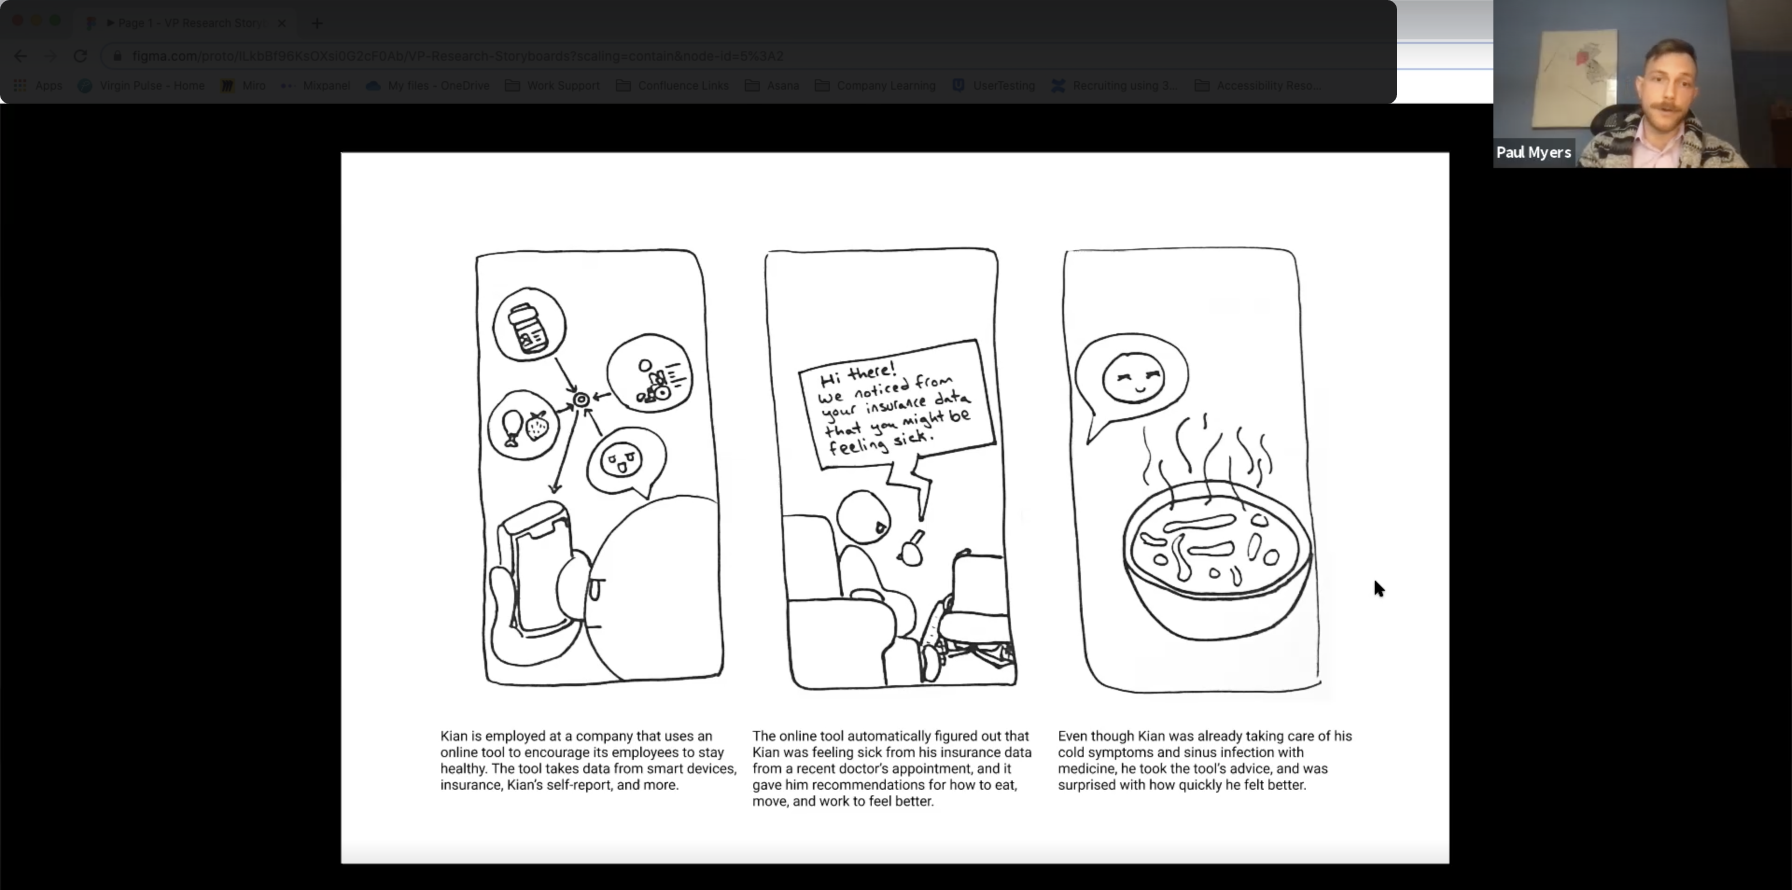
Storyboards
Each storyboard included three frames: an introduction to a problem (establishing context for solution), an intervention (the character interacting with a solution), and a conclusion (the problem being resolved via the solution).
Each storyboard included a caption under each frame. By reading the caption aloud and viewing the story, the participants were able to reflect upon a solution in the context of someone else's life instead of trying to predict how they might respond if asked directly, "how would you act you could use [insert solution here]?" A storyboard example is shown below.
I made each storyboard using a sharpie and plain paper, then scanned and cleaned using Figma, where I also added the caption using digital text (for ease of reading).
I made each storyboard using a sharpie and plain paper, then scanned and cleaned using Figma, where I also added the caption using digital text (for ease of reading).
Data Collection
Sessions were approximately 60 minutes total: 5-10 minutes of introduction and warm-up, 35-45 minutes of evaluating storyboards, and 5 minutes of debrief at the end. I conducted all sessions remotely, via Zoom, and I gathered consent for the sessions using a research consent form sent out via DocuSign. I compensated participants via Amazon Gift card for successful completion of each session.
Knowing that there were fifteen storyboards to test in this timeframe, participants were encouraged to lean into their first thoughts about the storyboards. By getting into a quick flow of storyboard/solution-sharing - which is why the method is called "Speed Dating" - I was able to assess participants' gut reactions. I encouraged note-takers to focus on beliefs, assumptions, needs, or attitudes, and especially to call out particularly positive or negative sentiment quotes.
I read the caption of each storyboard aloud, then gave the participant time to share
how they felt about the character's success using the provided solution
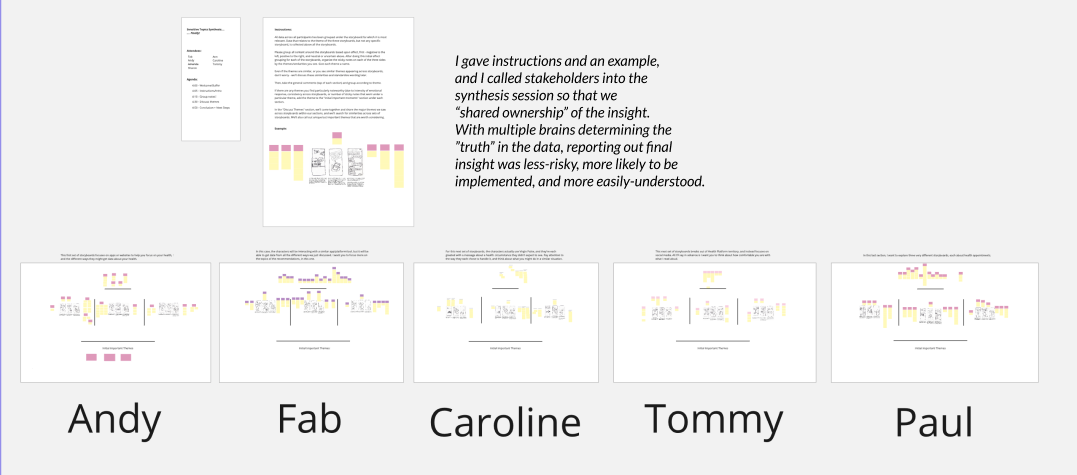
I led the synthesis workshop with an example, and we split up the work to share the sense-making.
Data Analysis and Synthesis
I brought two UX Designers - my note-takers - the product manager, and the content writer for the team into an analysis workshop with me. This granted me greater leverage later on advocating for changes, as the delivery team stakeholders were included in the "sense-making" process along the way.
Because affinity diagramming is a complex, lengthy method, I applied a workaround that brought me success on past speed dating projects. In Miro, I made a digital whiteboard including each set of storyboards. Below each storyboard, I included every note taken about each storyboard across all nine sessions, and I assigned one set to each stakeholder.
The first layer of analysis was to group notes into "positive", "negative", and "neutral". Positive affect notes were moved to the right of each storyboard, negative to the left, and neutral atop. After this, a second layer of analysis was conducted: within each "side", the teammate then grouped the notes into similar themes and gave them a title. An example (intentionally too zoomed out to show specific details) is shown to the left.
Using this analysis method allowed stakeholders to make sense of which concepts tested the best or produced the most discomfort from a glance - and we then discussed the themes we found in each set, weaving threads of synthesis between each set of storyboards. From this discussion, I was then able to create a presentation with insight and recommendations for the delivery team.
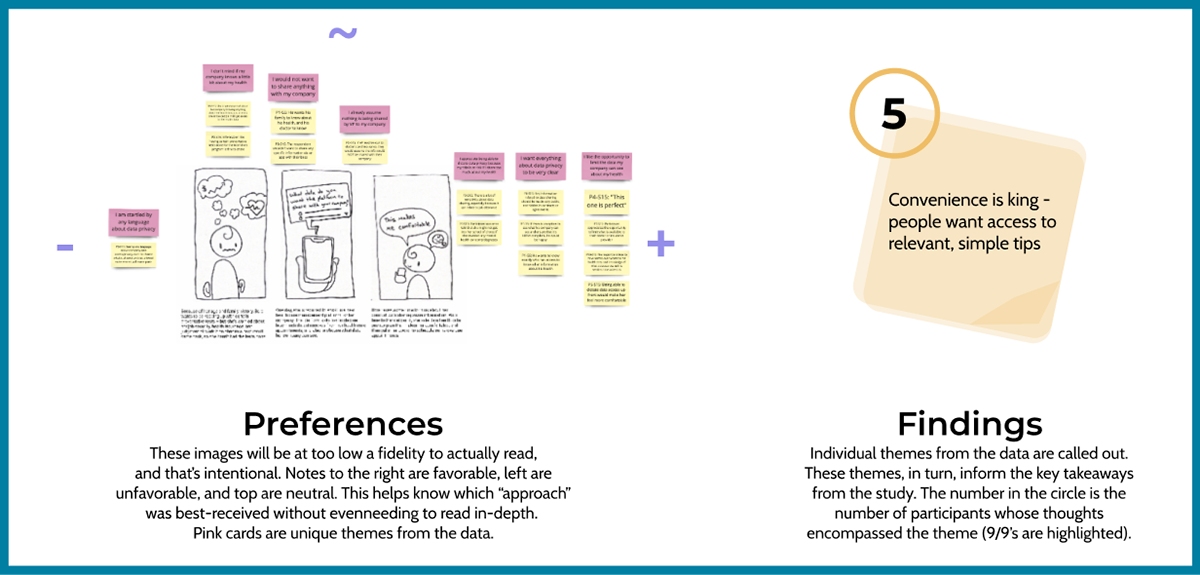
I shared takeaways at two levels of detail: high-level scanning of response affect, and detailed findings articulated from theming notes
From insight to impact
The scope of data from this study was fairly large - 333 notes from approximately 6.75h of active session time - but by leading the group analysis and synthesis, I was able to quickly move from data collection to reporting. Those 333 notes served as the evidence for 36 findings about our users, and by weaving relevant findings together, I reported on 4 insights, being:
• Automation about health recommendations is often only unsettling when it's a surprise, sensitive, or mandatory
• A little context of what's "behind the curtain" of machine learning can add a lot of comfort
• People value choice, control, and predictability - even in small interactions on an app
• People need time to feel uncomfortable about their health. Giving such space may help them be more likely to listen to advice
These insights shaped the delivery team's backlog of tasks within that release period to actually build the "ask me later" functionality into certain interactions on our platform - meaning the initial research goal was successfully reached. Additionally, it informed the strategy of a friendly, lightly-intelligent/lightly-conversational goal-setting agent on our platform that launched as a part of a subsequent release, and are regularly returned to by different delivery teams trying to strategically alter our members' behaviors in ways to improve their health or wellbeing.